Boutique Media & consulting group
 BTC
BTC$118729
 ETH
ETH$3873
 BNB
BNB$847
 XRP
XRP$3.23


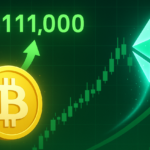
Bitcoin (BTC) is nearing the resistance level of $70,000. If it closes above this threshold, it might spark a rally, potentially retesting its all-time high. Ethereum (ETH) is approaching its downtrend line; breaking above it could signal a rebound. Ripple (XRP) is consolidating around its 200-day moving average, and a breakthrough here could lead to gains. The Relative Strength Index (RSI) indicates that the market is near the overbought zone, suggesting a possible pullback if the resistance levels aren’t breached. Overall, the cryptocurrency market faces significant support and resistance challenges.
The price of Bitcoin is approaching the $70,000 resistance level. If it holds above this level at closing, it could trigger a rebound and retest its peak. Ethereum’s price is nearing its downtrend line; breaking and closing above it indicates potential for a future rebound. Ripple’s price is consolidating around its 200-day moving average of $0.552; closing above this level suggests a possible recovery.
BTC/USD Daily Chart
If BTC fails to break the $70,079 level, it might drop and find support around the critical $66,000 level. If Ethereum closes above the downtrend line, it could rise. ETH found support around its 50-day EMA of $2,564 on October 15th and is nearing the downtrend line (connecting several highs since late May). Breaking and closing above $2,820 could lead to a rebound, retesting the $2,927 daily resistance level. A successful close above $2,927 might extend gains, retesting the weekly resistance of $3,236. The daily RSI is currently at 66, near the overbought level of 70. If it closes in this area, traders are advised against adding long positions due to increased pullback risks. However, the rally might continue with RSI in the overbought area.
If ETH fails to close above the downtrend line, it might reject and retest the 50-day EMA support of $2,564. If XRP closes above the 200-day moving average, it might rise. Last week, XRP consolidated around the 200-day moving average of $0.552. As of Monday, it traded around $0.547, near the 200-day moving average of $0.552. Breaking and closing above $0.552 could lead to a 13% rise, retesting the next daily resistance of $0.626. The daily RSI is 48, near the neutral level of 50, indicating trader indecision. For bullish momentum, the RSI needs to stay above neutral. Conversely, if XRP fails to close above $0.552 and closes below the daily resistance of $0.544, it might lead to a decline, retesting the October 3rd low of $0.506.
Disclaimer: This price analysis article serves as reference only and should not be construed as financial or investment advice. Before making any financial decisions, please conduct your own research and consult professionals.
Sentiment: Positive
See also