The price of Bitcoin tumbled by -15.3% after news broke that Tesla will no longer accept $BTC as payment.
The top coin has struggled to bounce back since, with metrics pointing to panic sell-offs and waning sentiment shortly after the correction. The ongoing investigation against world-largest exchange doesn’t help either. Binance Holdings Ltd. is under investigation by the Justice Department and Internal Revenue Service, ensnaring the world’s biggest cryptocurrency exchange in U.S. efforts to root out an illicit activity. Binance is incorporated in the Cayman Islands and has an office in Singapore but says it lacks a single corporate headquarters. Chainalysis Inc., a blockchain forensics firm whose clients include U.S. federal agencies, concluded last year that among transactions that it examined, more funds tied to criminal activity flowed through Binance than any other crypto exchange.
These and couple of smaller factors had a significant influence on cryptomarket and pushed the price down.
Alongside the massive spike in its social volume, Bitcoin hit an interim bottom around $48.3k, before shortly rebounding to as high as $51.3k on Friday. Today we can see the continuation of this trend, with Bitcoin hitting as low as 42k, but we are likely to see a bounce back to over 48-50k level soon. And here is why
Let’s take a look at Bitcoin’s Network Realized Profit/Loss chart which tracks the overall ROI across all daily Bitcoin transactions:

NPL is quite simple: for each unit of BTC that moves on the blockchain, we take the price at which it last moved and assume this to be its acquisition price. Once it changes addresses again, we assume this to be its sell price. Because of this, spikes in NPL suggest that the coins currently moving on the blockchain are – on average – being moved/sold at a significant profit, and vice versa.
Bitcoin’s NPL has seen considerable growth shortly before the Thursday crash, suggesting elevated profit-taking and risk-off behavior by some holders. What’s perhaps even more interesting, however, is that Bitcoin’s NPL after the drop recorded two of the biggest dips since the beginning of the rally, suggesting panic sell-offs and ‘weak hand’ capitulation as Bitcoin broke below $50k for the first time this month.
Now, let’s take at MVRV
On Saturday, Bitcoin’s 30-day MVRV ration hovered at -10.9%, indicating that all addresses that have acquired BTC in the previous 30 days are – on average – down 10.9% on their initial investment.

As a rule of thumb, the higher the MVRV ratio, the greater the unclaimed profits and – in turn – the higher the risk that BTC holders will begin to sell and reduce their exposure. This is why some on-chain analysts believe that extremely high MVRV ratios indicate ‘overvalued’ conditions, while very low MVRV ratios can present an opportune time to accumulate.
As expected, Bitcoin’s short-term MVRV is considerably low at present, courtesy of the last 72 hours of price action. Bitcoin’s 30-day MVRV has often shown a tendency to ‘bottom out’ between 12%-15% over the past 3 years, which makes its current level quite close to the historical ‘support’ line.
Unfortunately, as I am writing this article, the price of Bitcoin went as low as $43,000 approaching 42k supporting line. However, I doubt that BTC will move below 40k this week.
As for the annual MVRV ratio (365 days), on the other hand, presently sits at +26.2%, notably its lowest level so far this year:

That said, the 365-day MVRV ratio remains very much positive, suggesting there are still profits that can be realized by long-term BTC holders, especially if they believe further correction may be imminent.
Now, let’s take a look at ETH stats

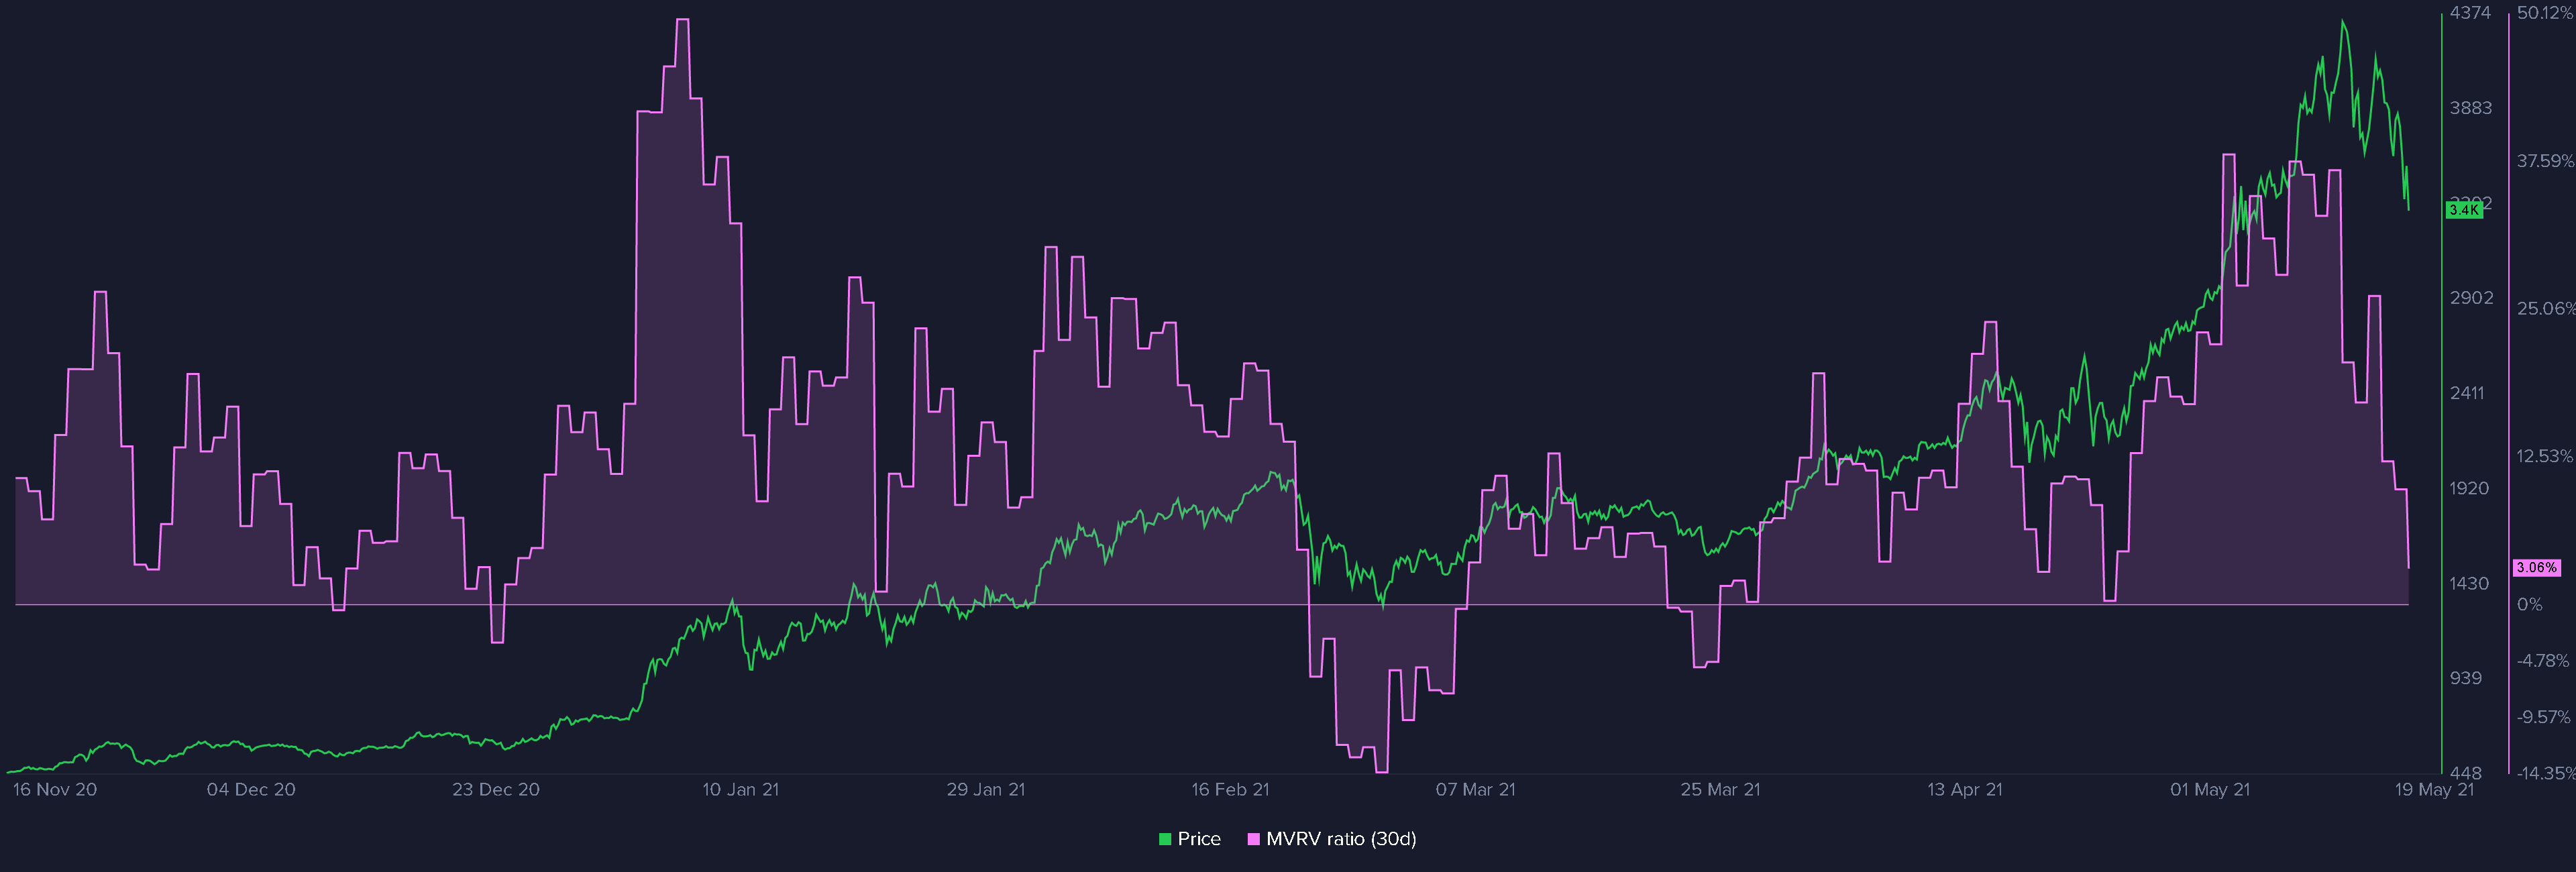
ETH’s current MVRV-30 ratio is even lower than Bitcoin’s indicating that we are reaching the support line. It doesn’t mean that ETH won’t move lower, but I don’t see it going anywhere down to $2000 in a short-term period.
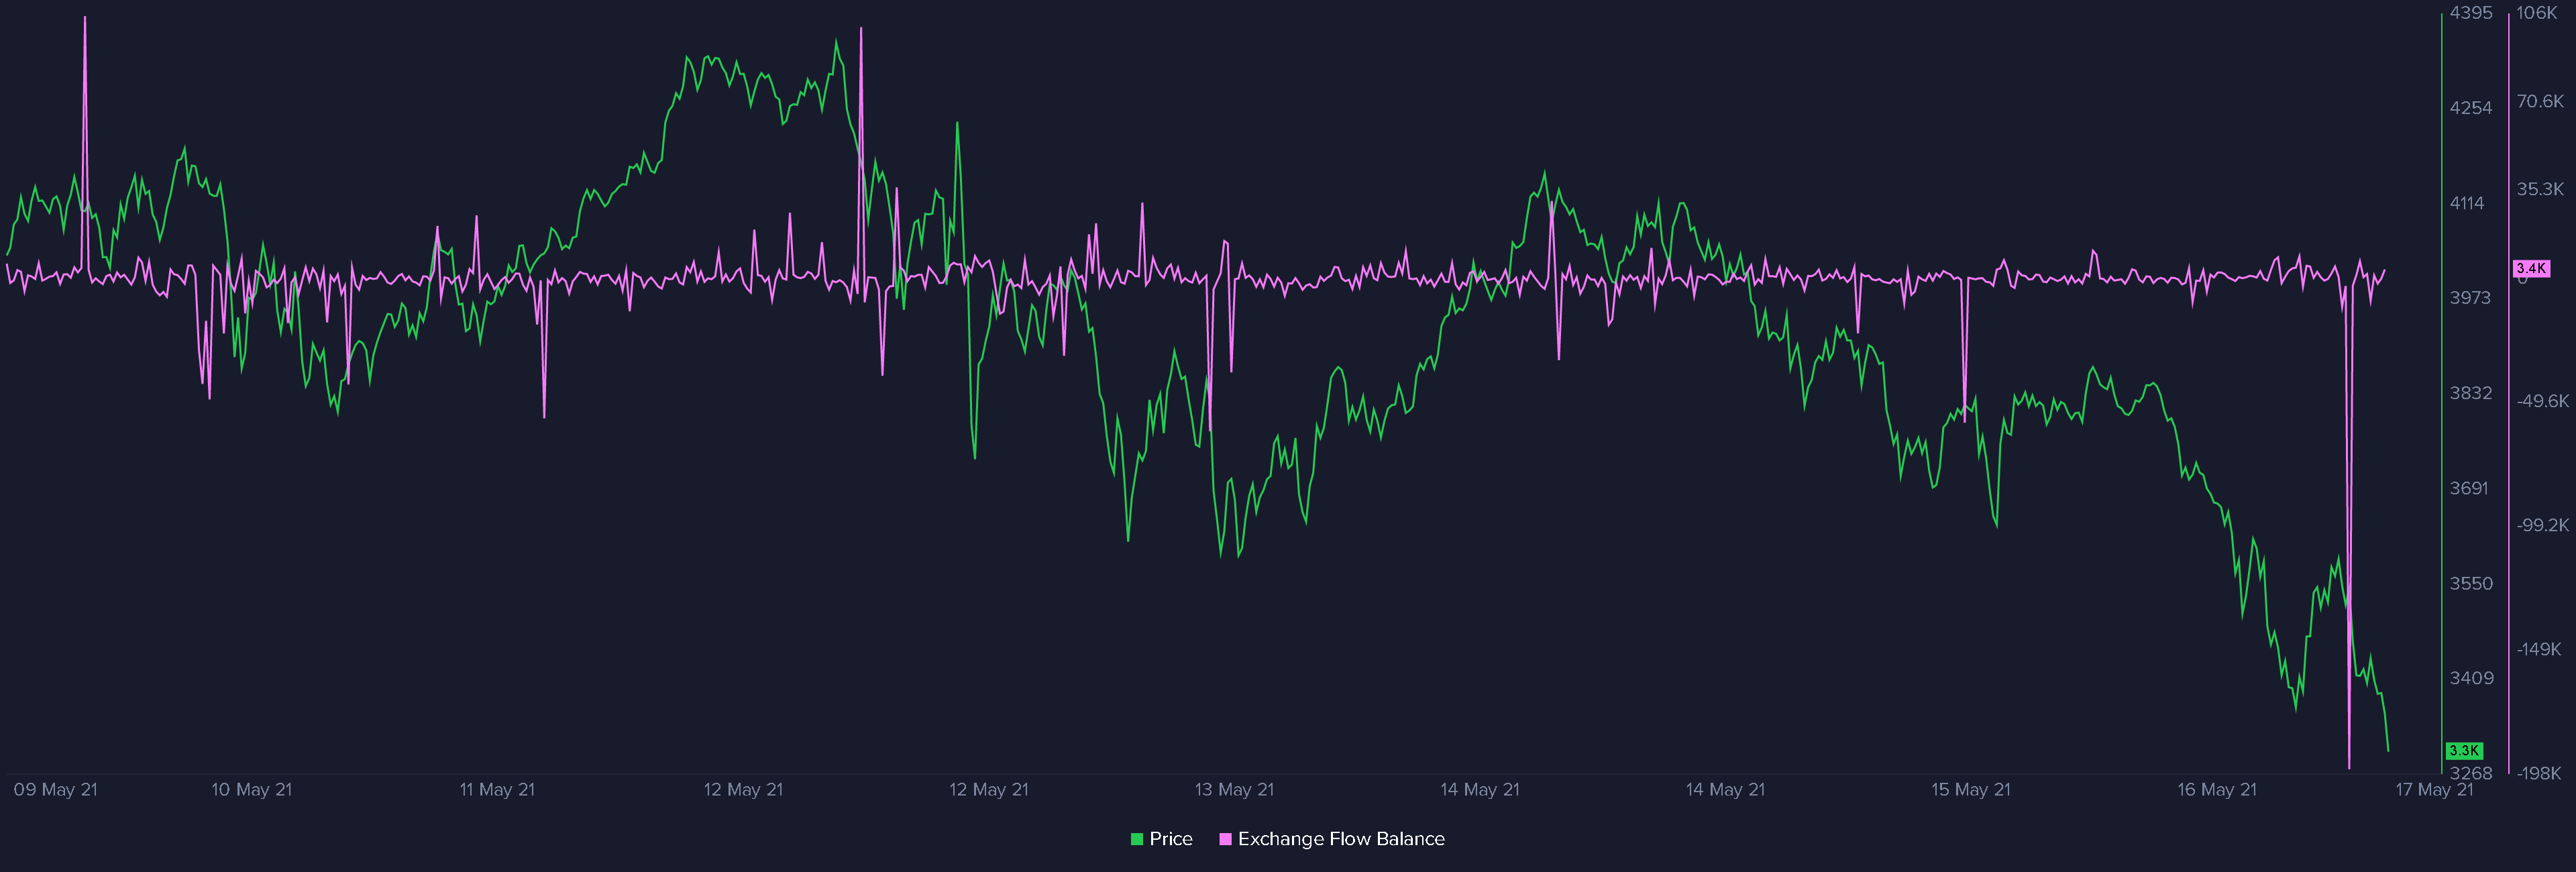
Another interesting move that I noticed was the Exchange Flow Balance spike earlier today

Exchange Flow Balance shows the difference in the amount of ETH tokens moving to and out of exchange wallets. If the value is positive, more ETH entered the exchange than have left. If the value is negative, more ETH flowed out of exchanges than flowed in. Apparently, a massive amount of tokens were moved out of exchanges, which usually a good bullish sign. This indicates that overall we still have bullish sentiment and should see ETH price recovery.
Quick price summary:
Now, a quick mention of Cardano. Most of you who have been reading our Market Analysis section know that I was holding ADA from when it was 9 cents per token. Today, I sold 1/4 of my Cardano at $2.34 and plan to buy it back at around $2 and possibly $1.80. My long-term Cardano target has shifted and I currently aim to sell Cardano for around $4 USD and hold the rest for the next bullish cycle. I still hold my ground and believe that Cardano is going to be at least $8-10 during the next bull cycle, hence it’s a great buy under $1 USD.
Now, quick glance at some Altcoins that I recommend to check:
Summary: Considering all the news, I think that it’s safe to sell some of Binance tokens. Today I sold almost all my Binance Tokens, as such a massive crackdown on Binance can have horrible consequences. While the short-term looks quite bearish, I do not think that the bullish cycle has ended. That being said, I would like to remind you that taking profits along the way is the best strategy that you can follow to minimize your risks: as I sold most of my ETH at $2000, $3000, and still hold some for $5000 and $10000.
See also