Boutique Media & consulting group
 BTC
BTC$107645
 ETH
ETH$2519
 BNB
BNB$660
 XRP
XRP$2.31


Earlier this month it became known that PayPal plans to make crypto payments available at 26 million merchants globally, as it received the first conditional Bitlicense from the New York Department of Financial Services. The services are expected to launch at the beginning of 2021. This announcement boosted bullish BTC sentiment and the price surpassed an important psychological mark at $15000.
In my previous article, I stated the following: “Bitcoin has the potential to move over $14.4k and even over $15k for a brief period but it’s very unlikely that it will be able to hold over it for a long time“
Surprisingly, Bitcoin was able to stay over that mark for more than two weeks and then even surpassed the $18k mark. So what made me think that the correction was coming, and why do I think that we are still in a gambling phase.
If you will look at the Daily Active Addresses vs Price Divergence, you will notice that BTC shows long red candles that indicate an alarming divergence between daily active addresses and price. While this indicator doesn’t tell when the correction will happen, it tells us how severe and rapid the correction will be

If you paid attention to the graph, you might have noticed that the DAA vs Price Divergence remains in the bearish zone since October, yet the price is growing and heading towards $20k. As the price goes up, the divergence is growing, creating a much stronger, bearish signal. So why the correction doesn’t happen despite all these indicators that worked well in the past?
As Thanksgiving is coming close, I thought that a brief story about a turkey would be the best explanation. If you are familiar with Western Philosophy, you have probably heard about Bertrand Russel. In his book “The Problems of Philosophy” he formulated the problem of induction in a simple, yet understandable way:
“The turkey found that, on his first morning at the turkey farm, he was fed at 9 a.m. Being a good inductivist turkey he did not jump to conclusions. He waited until he collected a large number of observations that he was fed at 9 a.m. and made these observations under a wide range of circumstances, on Wednesdays, on Thursdays, on cold days, on warm days. Each day he added another observation statement to his list. Finally, he was satisfied that he had collected several observation statements to inductively infer that “I am always fed at 9 a.m.
However, on the morning of Christmas eve, he was not fed but instead had his throat cut. “.
This is quite a good illustration of what happens when we try to make an accurate forecast using inductive reasoning, forgetting that it doesn’t matter how many cases we list during our inductivist reasoning, nothing guarantees that previous cases will determine the outcome of the future cases.
At this point, you probably think “Okay Vlad, enough about philosophy, turkey, and inductive reasoning. What about Bitcoin?”
As for Bitcoin, I still hold my ground and think that BTC will go through a 25-35% correction but it’s much more difficult to make a precise call on when to expect it. Several large and important factors influence the Bitcoin and world markets in general. So far, most of the predictions regarding stock markets, BTC, COVID-19, and recovery were wrong regardless if they were made by armchair experts or Nobel Prize winners.
Let’s take a look at major factors that currently influence Bitcoin:
In my opinion, if somebody could guess the timing precisely it’s more likely to happen due to luck rather than some analytical reasoning. The only thing we can say with relative certainty (keep in mind the turkey example) is that despite wars, political and economical crises, and natural disasters, stocks always recovered and moved forward. Enough with the theory, let’s look at the data
BTC MVRV.

MVRV – shows the average profit or loss of all BTC holders based on the price when each token last moved. Buyers who hold BTC for 60 days are at 24% profit, and those who hold 90 days are at 27% accordingly.
This can be interpreted as a weak bearish signal, but it’s not strong enough to cause a massive selloff. It’s also important to remember that there is no such law that forces people to sell Bitcoin after reaching a specific MVRV number, hence it’s better to use MVRV only as a supportive indicator.
Social Sentiment and Social Volume
One of the best metrics available on Santiment is the Social Volume as it demonstrates the number of mentions of the coin on 1000+ crypto social media channels, including Telegram groups, crypto subreddits, discord groups, private traders chats, and more

On this graph, I marked where spikes in social volume coincided with surges and drops – with green and red colors respectively. As we can conclude from this graph, BTC is getting social attention but it’s not as significant as it was in March, May, and August. That being said, it’s not necessarily a bad thing for Bitcoin: any overhyped asset is unable to hold its ground for a long time. If an asset is capable of growing without a massive social hype, it can be interpreted as a positive signal.

When it comes to a weighted social sentiment, the overall trend bullish, although it significantly dropped in comparison with the beginning of the bull run that lifted BTC from 11k to 16k. It doesn’t look bullish enough to cause another 50-100% price growth in a short period, but social sentiment can change overnight. In my opinion, the significance of the social aka “collective” sentiment will only continue to incase due to some significant changes in Bitcoin distribution.

On this graph, I merged two categories of wallets. The green line represents all addresses that hold 0 to 10 BTC. Brown line represents addresses with more than 10 BTC. As we can observe, starting from August 2020, there are more addresses with a relatively small amount of Bitcoin (0-10 BTC) than there are addresses with more than 10 BTC. In my opinion, this is a crucial change that might increase the value of the general social sentiment over the personal decisions of whales.
Bitcoin summary:
ETH on-chain data looks much healthier and bullish than BTC, and unlike Bitcoin, it’s much further from its All-time-high value. Before jumping to data and numbers, let’s look at some important fundamentals that made me hold more ETH than BTC for a while.
Now, let’s take a look at the actual on-chain data.
At a first glance, ETH looks bearish on the DAA vs Price graph, however, in comparison with BTC, it looks much healthier and has more space for growth.

A more detailed version of DAA vs Price shows us that ETH price is diverging with daily active addresses, but DAA is trying to catch up with the increasing price.

Another important factor that I always consider is network growth. Since this metric illustrates user adoption over time, it can be very helpful at identifying projects that are gaining or losing traction.

We can see that network continues to grow as the price grows. In my opinion, it’s a very positive sign, which informs us about the number of new addresses being created on the network each day.
And finally, exchange inflow:
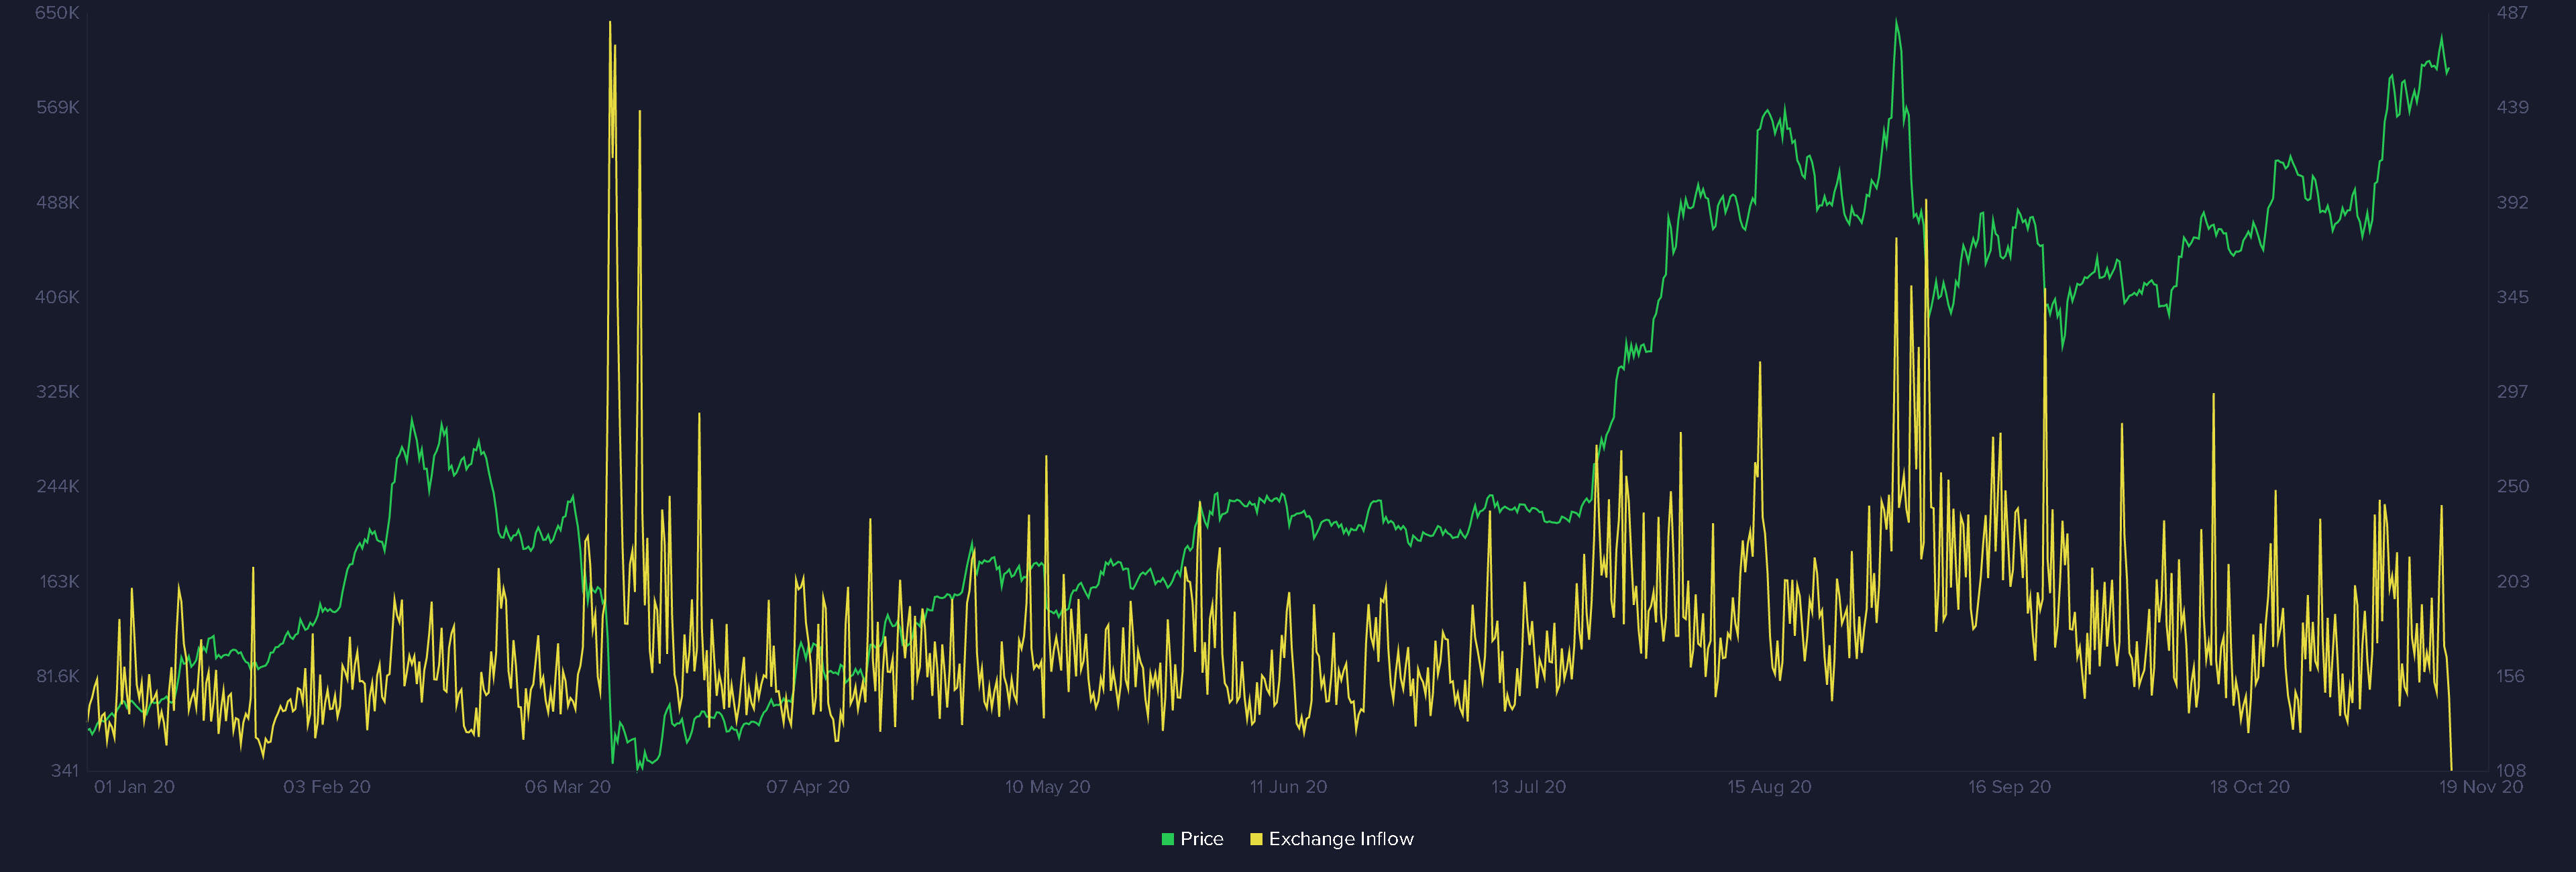
Exchange inflow shows us the amount of ETH moving to known exchange wallets daily. Sudden and rapid spikes usually go hand in hand with price drops as the sale pressure increases. As we can observe, the inflow of ETH to exchanges has decreased and continues to drop, which means that people are not in rush to sell their ETH yet. All these factors make me more confident about ETH
Disclaimer: The content is for informational and educational purposes only, you should not construe any such information or other material as legal, tax, investment, financial, or other advice. Nothing contained in my post constitutes a solicitation, recommendation, endorsement to buy or sell any assets
See also